Charting Database Data in VB.NET
For this assignment you are first going to create a Microsoft Access Database of 2014-15 Statistics for the Virginia Tech Hokies Basketball Team. Your application will read the data from the database and put it in a DataSet. Then using LINQ commands, you will first populate a combo box with player names. Then using other link commands you will display the statistics of a chosen player in text boxes and two different graphs.
The file involves an Excel file named Stats.xlsx with a worksheet named Stats that has the same name as the file with the following fields: First, Last, MNT, FGM, FGA, FTM, FTA, P3M, P3A, PTS, OFFR, DEFR, REB, AST, TOV, STL, BLK. The glossary for the field names can be found on a worksheet named Glossary. There are a total of 11 records in this worksheet. The file also includes the form frmStats, which has been designed for this application. It has a combo box named cboPlayer, which displays the last name of a player whose stats will be displayed on the form. The full name of the player, total number of minutes played and total points are displayed in text boxes txtName, txtMinutes and txtPoints, respectively. The first chart named chrStats1 is used for displaying field goals attempted (FGA) and field goals made (FGM), free throws attempted (FTA) and free throws made (FTM), and three-point field goals attempted (3PA) and three-point field goals made (3PM). The second chart named chrStats2 is used for displaying the remaining stats; namely, offensive rebounds (OFFR), defensive rebounds (DEFR), rebounds (REB), assists (AST), turnovers (TOV), steals (STL), blocks (BLK).
Remember that you can find LINQ and Chart examples in the completed InClass files on Canvas. The screenshot of the application is included at the end of the assignment for your reference. Please follow the instructions below in developing your application.
- Create a blank access database called HokiesBasketball.accdb in your project folder. Import the contents of the Stats worksheet in the Excel file Stats.xlsx to your database as a table with the same name, Stats. Do not assign a primary key when asked during the import wizard. When importing is complete, open the Stats table in the design view. Choose First and Last fields together and click on the primary key button.
- In file frmStats.vb, first import the libraries for the data connections and data visualization before the frmStats class code. Then, in the frmStats class, first create a Public property called MyDataSet as a new DataSet type. Write a Public Sub called GetData. This sub should connect to the database using a DataAdapter and fill MyDataSet with the entire contents of the table Stats from the database. GetData should be called when frmStats loads.
- Write a Public Sub called GetPlayers. In this sub, create a LINQ query over the Rows collection of the table in MyDataSet which return the players last names in ascending order in an output list called players. Then each item in players should be added to the combo box cboPlayer using a For-each loop. Finally, the first item of cboPlayer should be selected. GetPlayers should be called when frmStats loads.
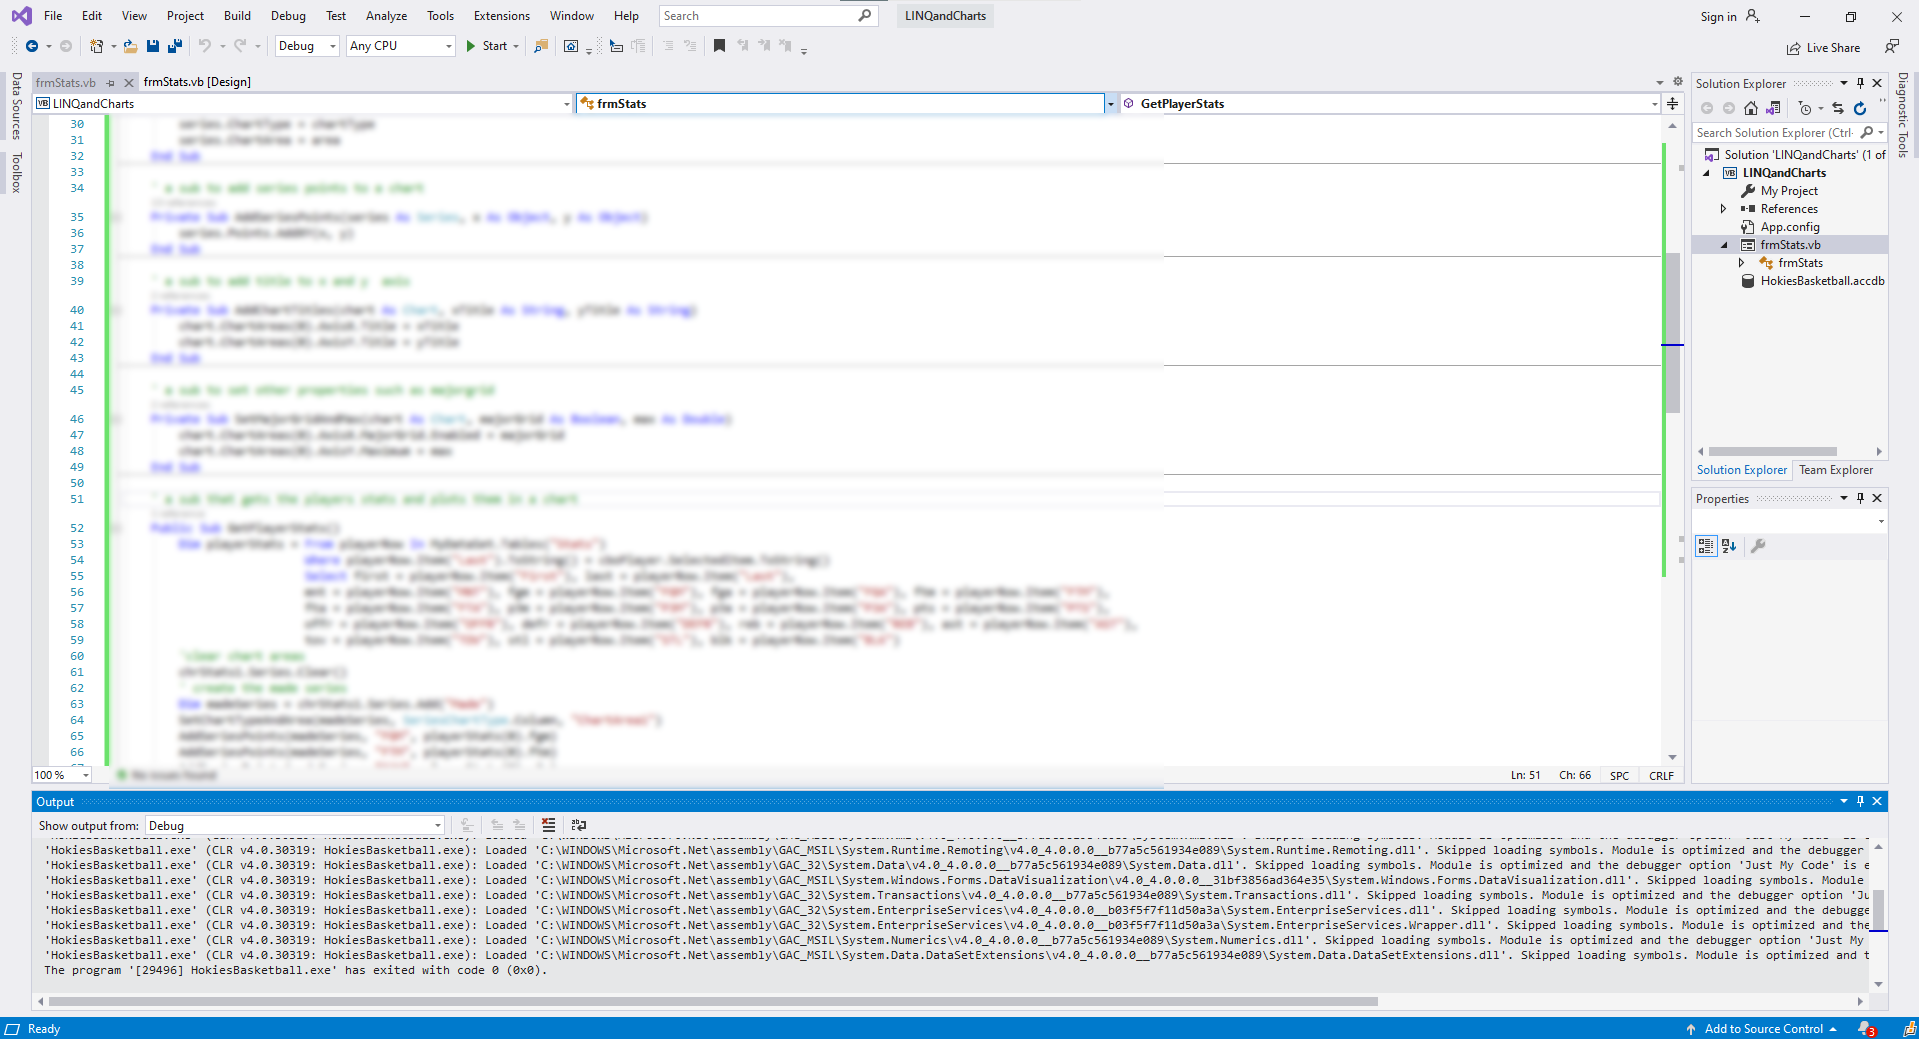
- Write a Public Sub called GetPlayerStats, which should be called when the selected index of cboPlayers changes. Consider using the With construct for long and repeated expressions. Write the code in GetPlayerStats that does the following:
a. Using a LINQ query over the Rows collection of the table in MyDataSet, return the rows with all of the fields from MyDataSet in an output list called pstats, where the field Last is equal to the Text property of cboPlayer. This query returns a single row inside the output list. Declare a new DataRow type variable and assign the single row in the LINQ query output list using index 0 (e.g. Dim row as DataRow = pstats(0)). You can retrieve any of the fields of this row variable using the field name (e.g. row("Last")).
b. Concatenate the First and Last fields of the row variable with a space in between and assign it to the Text property of txtName. Assign the MNT field of the row variable to the Text property of txtMinutes. Assign the PTS field of the row variable to the Text property of txtPoints.
c. Clear the Series collection of the chart chrStats1, add the series “Made”, set the ChartType of these series to SeriesChartType.Column, set the series chart area to “ChartArea1”, and add the points for fields FGM, FTM, and P3M from the row variable to this series as Y values, and the strings "FG", "FT" and "3P" as the X values. Add the series “Attempted” to chrStats1, set the ChartType of these series to SeriesChartType.Column, set the series chart area to “ChartArea1”, and add the points for fields FGA, FTA, and P3A from the row variable to this series as Y values, and the strings "FG", "FT" and "3P" as the X values. Set MajorGrid.Enabled property of AxisX to False and the Title property of AxisX to “Statistics”. Set the Maximum property of AxisY to the value of the FGA field from the row variable and the Title property of AxisY to “Count”.
d. Clear the Series collection of the chart chrStats2, add the series “Other Stats”, set the ChartType of these series to SeriesChartType.Column, set the series chart area to “ChartArea1”, and add the fields OFFR, DEFR, REB, AST, TOW, STL, and BLK from the row variable to this series as Y values and the string versions of these fields as X values. Set MajorGrid.Enabled property of AxisX to False and the Title property of AxisX to “Statistics”. Set the Maximum property of AxisY to the maxium of REB and AST fields from the row variable (using function Math.Max), and the Title property of Axis Y to "Count".
Need a custom answer at your budget?
This assignment has been answered 2 times in private sessions.
Or buy a ready solution below.
Buy ready solution
Solution previews